fplot() is designed to combine a standard R plot with a categorical (factor) legend.
Analogous to splot(), splits the plotting region into a main panel and a
legend panel, and uses legend() to draw the labels with their colors and symbols.
Usage
fplot(
  labels,
  col = hcld.colors(length(labels)),
  type = c("box", "point", "line"),
  pch = 16,
  lty = 1,
  lwd = 2,
  cex = 1,
  border = col,
  pt.cex = cex * 1.5,
  seg.len = 1.5,
  horizontal = FALSE,
  legend.shrink = 1,
  legend.width = NULL,
  legend.mar = NULL,
  legend.lab = NULL,
  legend.x = "center",
  bigplot = NULL,
  smallplot = NULL,
  add = FALSE,
  ...
)
Arguments
- labels
vector with the category labels.
- col
colors associated with each level (same order as
labels). Defaults tohcld.colors().- type
type of symbols shown in the legend:
"box"for filled color boxes (as in a classic factor-level legend),"point"for points, or"line"for line segments.- pch
plotting ‘character’ (symbol) used when
type = "point".- lty, lwd
line types and widths for lines appearing in the legend, when
type = "line".- cex
text/symbol size in the legend.
- border, pt.cex, seg.len
additional
legend()parameters, also used to estimate the required legend width/height. The default values are:border = col,pt.cex = cex * 1.5andseg.len = 1.5.- horizontal
logical; if
FALSE(default) legend will appear on the right side. IfTRUEthe legend will be along the bottom.- legend.shrink
amount to shrink the size of legend relative to the full height or width of the plot.
- legend.width, legend.mar
control the size and margin of the legend panel, as in
splot(). If left asNULL(default), they are computed automatically following the same character-size logic thatlegend()itself uses internally.- legend.lab
legend title.
- legend.x
legend location relative to the legend panel (argument
xoflegend()). Possible values are:"center"(default),"bottomright","bottom","bottomleft","left","topleft","top","topright"or"right".- bigplot, smallplot
plot coordinates for main and legend panels. If not passed these will be determined within the function.
- add
logical; if
TRUEthe legend is just added to the existing plot (the graphical parameters are not changed).- ...
additional arguments passed to
legend().
Value
fplot() invisibly returns a list with components: bigplot,
smallplot, old.par, col and labels (par(old.par) will reset plot
parameters to the values before entering the function).
Side Effects
The plotting region (par("plt")) may be changed
after exiting, to make it possible to add more features to the plot.
They can be restored using the old.par returned values or by calling
function par.reset().
Examples
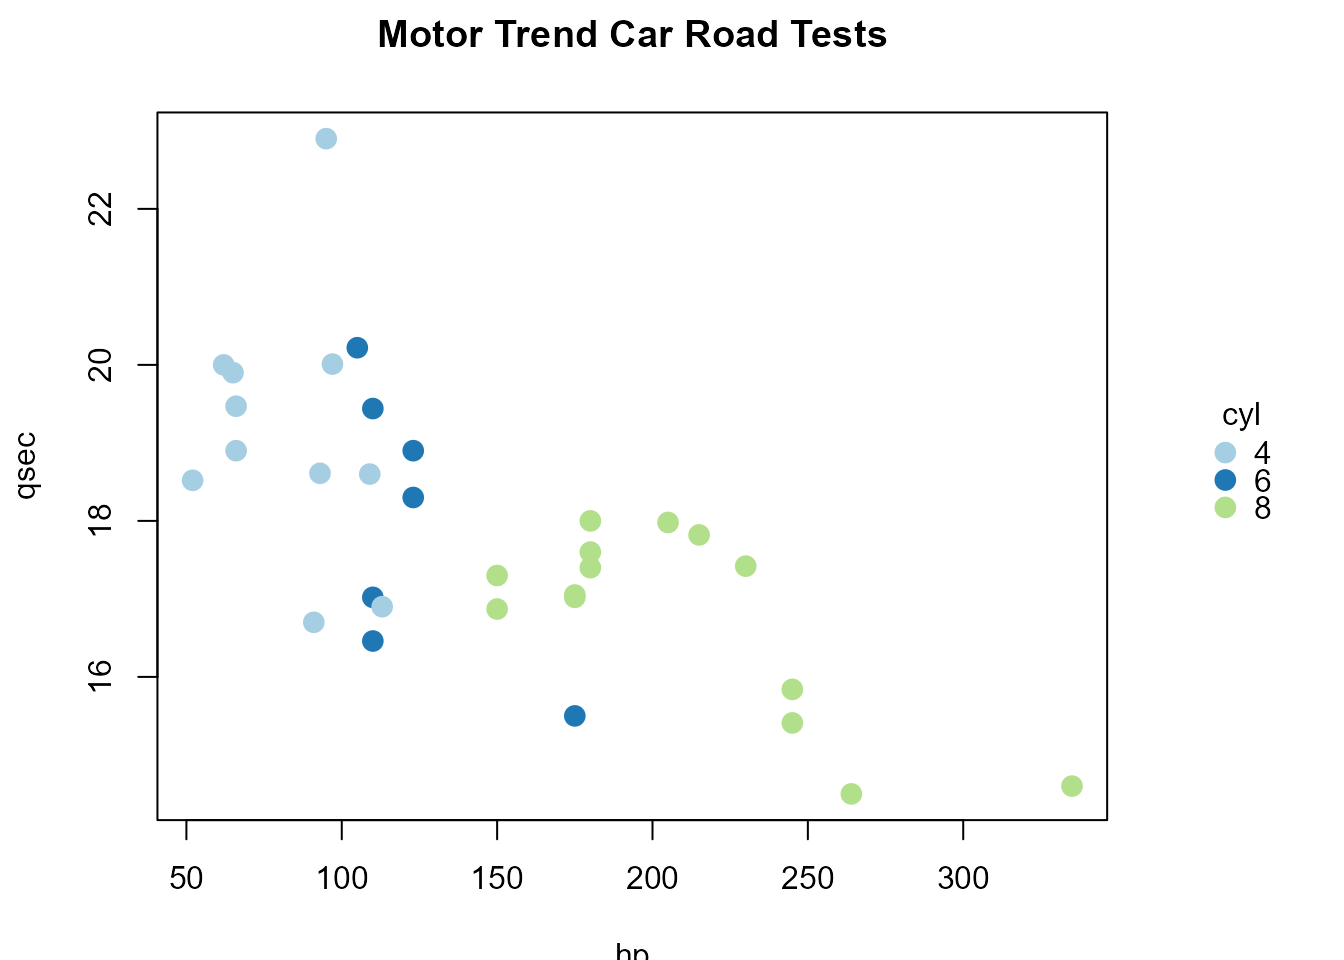
# Plot equivalent to fpoints():
f <- as.factor(mtcars$cyl)
res <- fplot(levels(f), col = cat.colors(f), type = "point",
legend.lab = "cyl")
with(mtcars,
plot(hp, qsec, col = fcolor(f, col = res$col),
pch = 16, cex = 1.5, main = "Motor Trend Car Road Tests")
)
 par(res$old.par) # restore graphical parameters