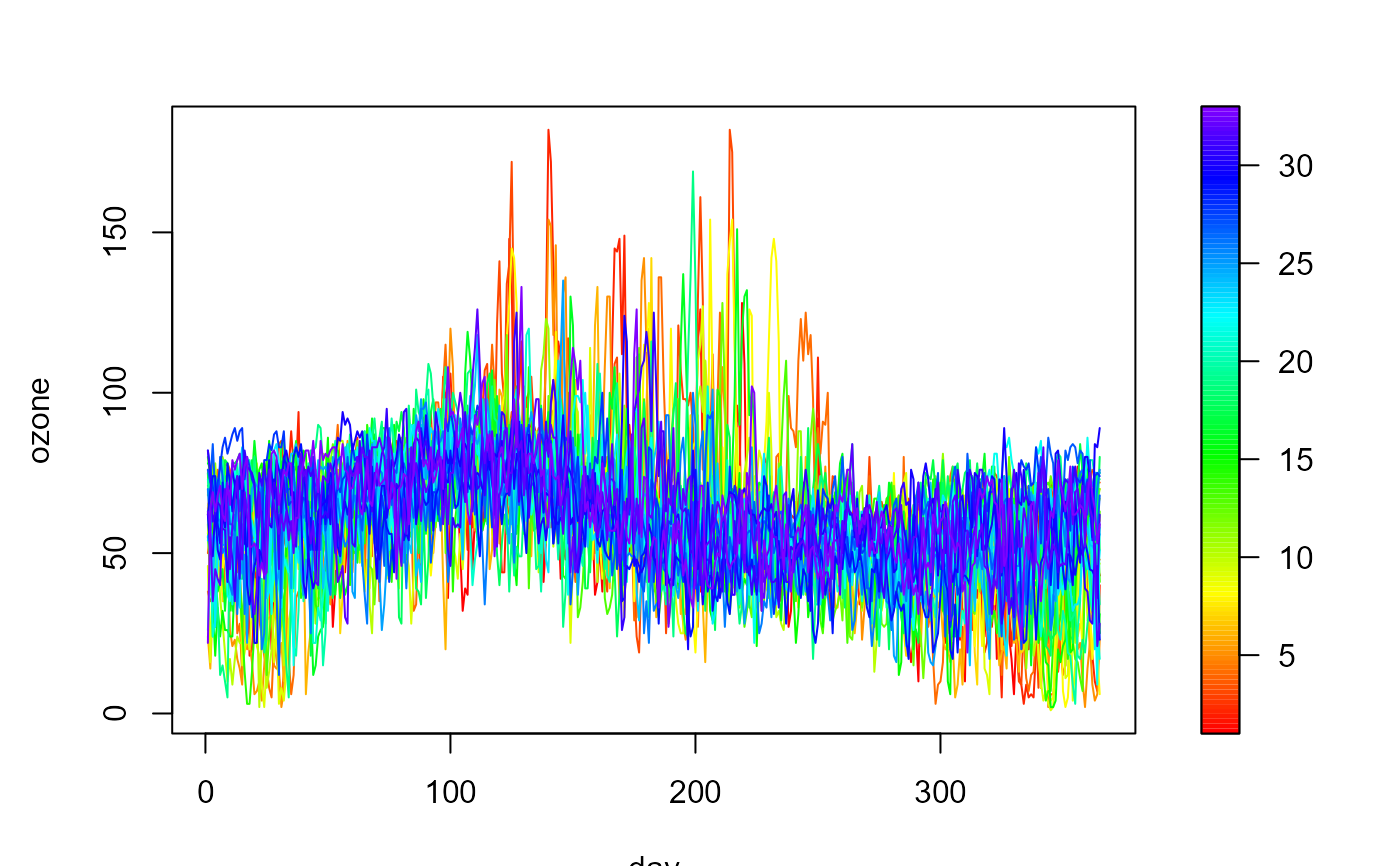
Daily averages of ozone concentration (microgram per cubic meter) recorded over the period from 1988 to 2020 at the Yarner Wood AURN monitoring site in the UK.
Format
A matrix with 365 rows (days) and 33 columns (years).
Source
The UK Automatic Urban and Rural Network (AURN).
The data were downloaded from https://uk-air.defra.gov.uk/data and preprocessed
with the climatol package (by applying the usual outlier
detection and data imputation methods).
Details
It is assumed that the observations corresponding to each year are (partial) realizations of a functional process, so the data consist of 33 curves observed at 365 discretization points.
