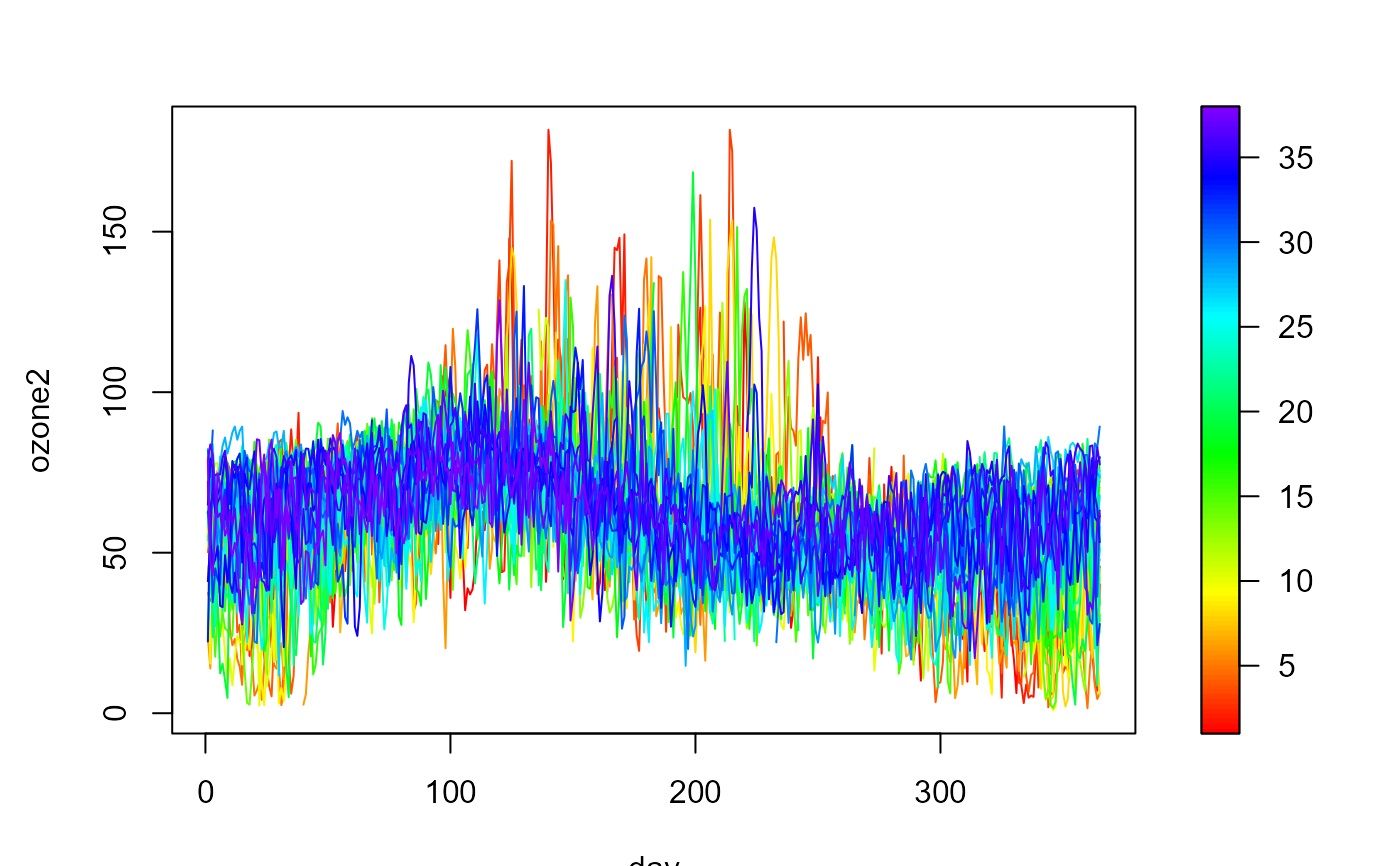
Daily averages of ozone concentration (microgram per cubic meter) recorded over the period from 1988 to 2025 at the Yarner Wood AURN monitoring site in the UK.
Format
A matrix with 365 rows (days) and 38 columns (years).
Source
The UK Automatic Urban and Rural Network (AURN). The data were downloaded from https://uk-air.defra.gov.uk/data.
Details
It is assumed that the observations corresponding to each year are (partial) realizations of a functional process, so the data consist of 38 curves observed at 365 discretization points.
See also
Examples
# Number of missing observations per year
apply(ozone2, 2, function(x) sum(is.na(x)))
#> 1988 1989 1990 1991 1992 1993 1994 1995 1996 1997 1998 1999 2000 2001 2002 2003
#>    9    5   21    0    2   41    0    0    5   36   38    2   63   10   24    0
#> 2004 2005 2006 2007 2008 2009 2010 2011 2012 2013 2014 2015 2016 2017 2018 2019
#>    4    7    7    2   19   20    0   58   29   12   16    1   18   23    5    9
#> 2020 2021 2022 2023 2024 2025
#>    6    0   30    0    0  205
# Create a multidimensional functional data set
fd <- npf.data(ozone2, dimnames = "day")
plot(fd)