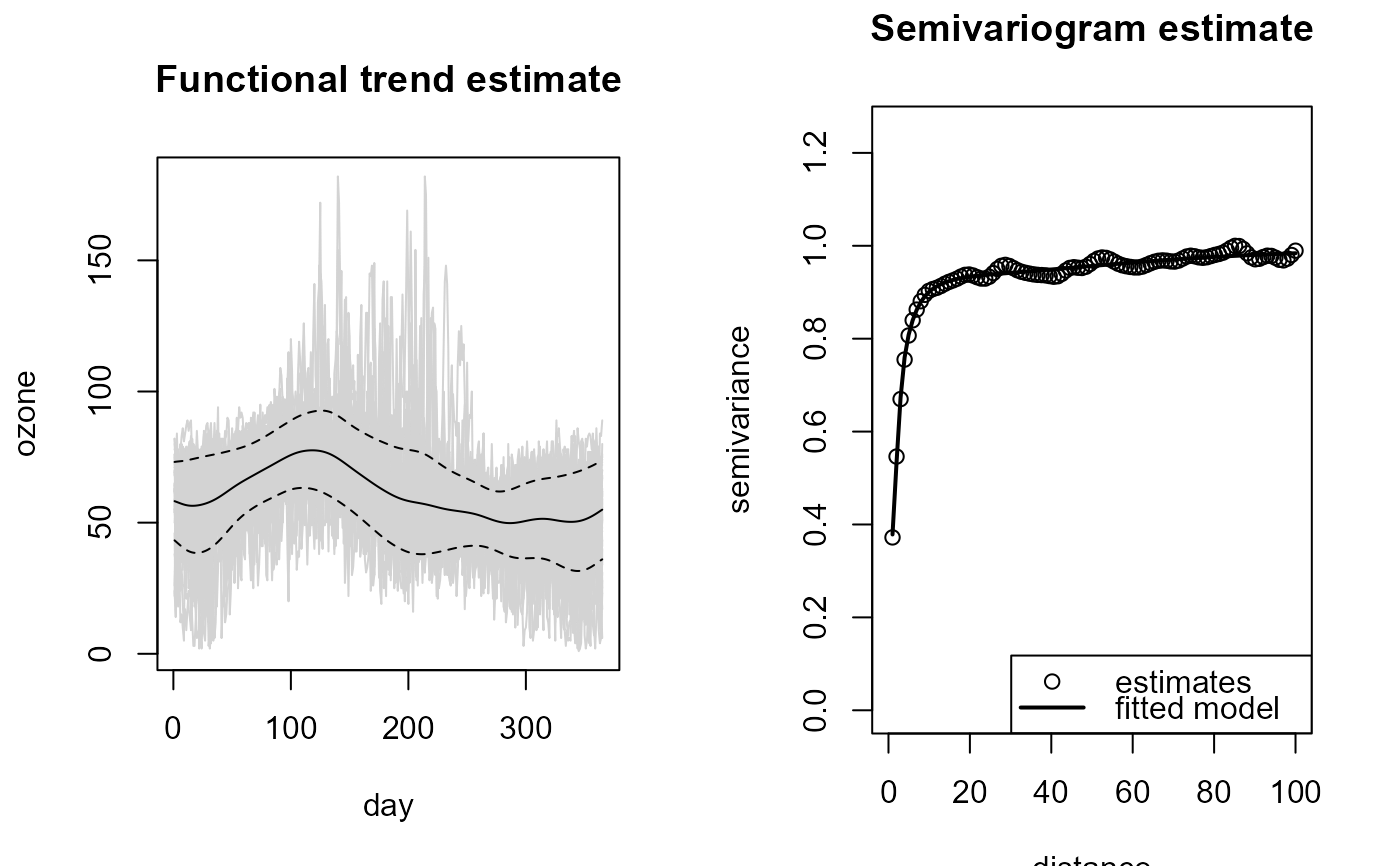
Fits a nonparametric functional model
(jointly estimates the trend, the variance and the variogram) by calling
locpol.npf.bin, np.var.npf.bin.res2, np.svar.npf.locpol and
npsp::fitsvar.sb.iso iteratively.
At each iteration, the trend and variance estimation bandwidths are updated
by calling h.cv.
npf.fit(x, ...)

# S3 method for default
npf.fit(
  x,
  iter = 2,
  tol = 0.1,
  h = NULL,
  var.h = NULL,
  svar.h = NULL,
  maxlag = NULL,
  nlags,
  dk = 0,
  verbose = FALSE,
  ...
)

# S3 method for npf.model
npf.fit(
  x,
  iter = 1,
  tol = 0.1,
  svar.h = x$svm$esv$locpol$h,
  dk = x$svm$par$dk,
  verbose = FALSE,
  ...
)
Arguments
- x
a (data) object used to select a method.
- ...
further arguments passed to
h.cv.npf.bin(trend bandwidth selection parameters).- iter
maximum number of iterations.
- tol
relative convergence tolerance (trend and variance bandwidths).
- h
initial bandwidth for trend estimation (final bandwidth if
iter = 0).- var.h
initial bandwidth for variance estimation (final bandwidth if
iter = 0).- svar.h
bandwidth for variogram estimation.
- maxlag, nlags
maximum lag and number of lags in variogram estimation (only one must be specified; see
np.svar.npf.locpol).- dk
dimension of the Shapiro-Botha variogram model (see
npsp::fitsvar.sb.iso).- verbose
logical; if
TRUE, the errors (the relative differences in trend and variance bandwidth selections) at each iteration are printed.
Value
Returns an object of class npf.model
(extending npf.locpol), the lp argument with the others as additional
components, and an additional component convergence with the number of iterations and
the relative differences in trend and variance bandwidth selections.
See also
Examples
fd <- npf.data(ozone, dimnames = "day")
fit <- npf.fit(fd, maxlag = 100, var.h = 30, verbose = TRUE)
#>
#> Iteration: 0
#> Trend bandwidth: 9.894684
#> Variance bandwidth: 30
#> Semivariogram bandwidth: 3.712871
#>
#> Iteration: 1
#> Trend bandwidth: 36.07592 , Error: 0.7257261
#> Variance bandwidth: 32.84395 , Error: 0.08658973
#>
#> Iteration: 2
#> Trend bandwidth: 36.07668 , Error: 2.090298e-05
#> Variance bandwidth: 33.10639 , Error: 0.007927349
plot(fit)
